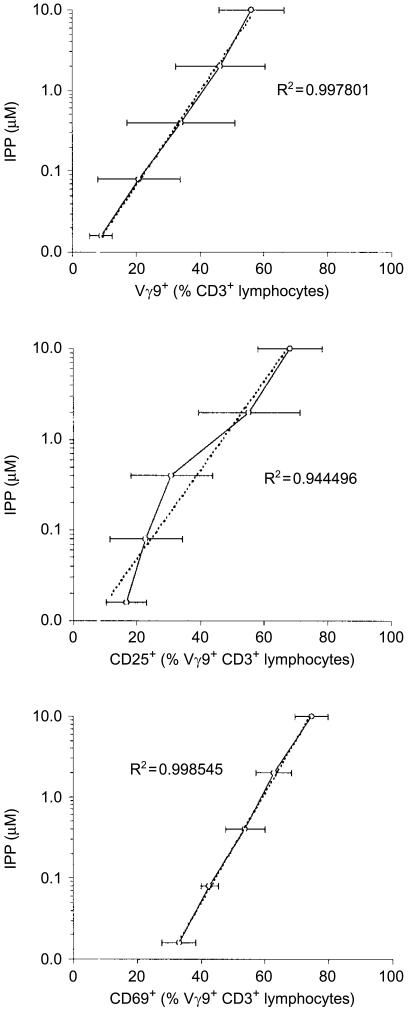
Figure 4.
Dose–response to isopentenyl pyrophosphate (IPP). Peripheral blood mononuclear cells were incubated with medium alone, or with IPP at different concentrations. The data represent the mean value±SEM from three donors analysed, for Vγ9+ T-cell outgrowth, and expression of CD25 and CD69 on Vγ9+ T cells. Trend lines and R2 values were calculated using Microsoft Excel software.

