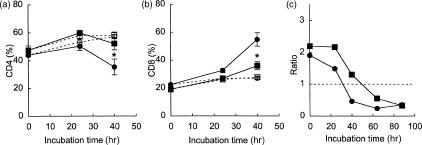
Figure 1.
Changes in the percentage of CD4+ (a) and CD8+ cells (b) in splenic T-cell cultures. Splenic T cells from SAMP1 (circles) or C3H/He (squares) mice were cultured with (closed symbols) or without (open symbols) concanavalin A (Con A). The data represent the mean value ± SE from three experiments. In one experiment, the cells were cultured for longer (c). The data from this experiment are shown as a ratio of the CD4+ cells to the CD8+ cells at each time-point. Statistically significant differences between the SAMP1 and C3H/He cells are shown by an asterisk (*P < 0·05).

