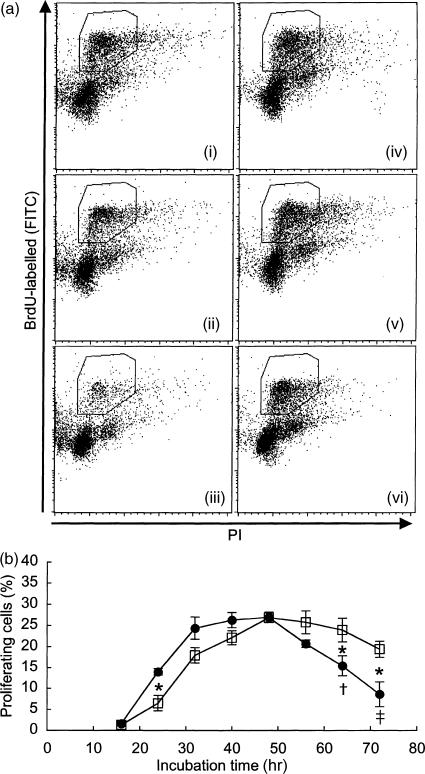
Figure 3.
Kinetics of proliferating cells in a purified CD4+ T cell culture stimulated with concanavalin A (Con A). At each time-point, the cells were labelled with 5-bromo-2′-deoxyuridine (BrdU) for the last 30 min of the culture period, and the percentage of proliferating cells was analysed by flow cytometry. Figure 3(a) shows representative dot-plot data from cells harvested at 48 hr (i and iv), 64 hr (ii and v) and 72 hr (iii and vi) of culture for SAMP1 (i–iii) and C3H/He (iv–vi) mice. The vertical and horizontal axes indicate the BrdU incorporation and the DNA content, respectively. Dot-plots of the proliferating cells are shown in the region surrounded by the solid line. Figure 3(b) represents summarized data from both SAMP1 (closed symbols) and C3H/He (open symbols) cells. The data represent the mean value ± SE from eight cell preparations, each of which was prepared separately from eight mice in four experiments. Statistically significant differences between the two strains (*P < 0·05, **P < 0·01) and between 48 and 64 or 72 hr of culture within each strain (†P < 0·05, ‡P < 0·01) are shown.

