Figure 7.

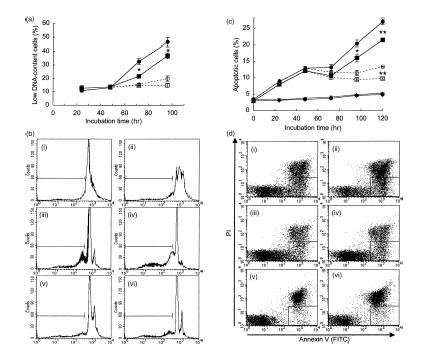
Apoptotic cells in a culture of purified CD4+ T cells. Cells from SAMP1 (circles) or C3H/He (squares) mice were stimulated with concanavalin A (Con A) and supplemented with interleukin (IL)-2 in some cultures (open symbols) but not in others (closed symbols) at 48 hr of culture. The percentage of low DNA-content cells was analysed by staining with propidium iodide (PI) and flow cytometry (a). Figure 7(b) shows representative data from three experiments. Histograms of cells at 24 hr (i), 48 hr (ii), 72 hr (iii and v) and 96 hr (iv and vi) of culture with (v and vi) or without (iii and iv) the addition of IL-2 at 48 hr in SAMP1 (closed histogram) or C3H/He (open) cells are shown. Histograms of the low DNA-content cells are shown within the marker. In addition, the percentage of annexin-positive and PI-negative cells, representing apoptotic cells, was analysed by using flow cytometry (c). Figure 7(d) shows representative data from three experiments. Dot-plots of cells at 96 hr of culture with (i–iv) or without (v and vi) Con A, and with (iii and iv) or without (i and ii) the addition of exogenous IL-2 at 48 hr of culture in SAMP1 (ii, iv and vi) or C3H/He (i, iii and v) cells are shown. Dot-plots from apoptotic cells are shown in the region surrounded by the solid line. The data represent the mean value ± SE from three experiments. Statistically significant differences between the two strains under the same culture conditions are shown (*P < 0·05, **P < 0·01).
