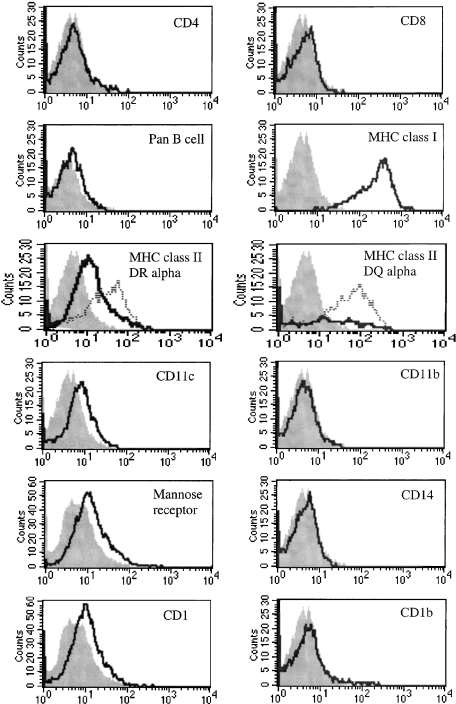
Figure 4.
Phenotypic analysis of ovine dendritic cell (DC) cultures by flow cytometry. Cells were stained with control isotype antibodies (filled histograms) and a panel of cell-surface antigen markers (open histograms). Major histocompatibility complex (MHC) class II up-regulation in response to lipopolysaccharide (LPS) is denoted by dotted histograms. Each histogram is representative of at least three different experiments.

