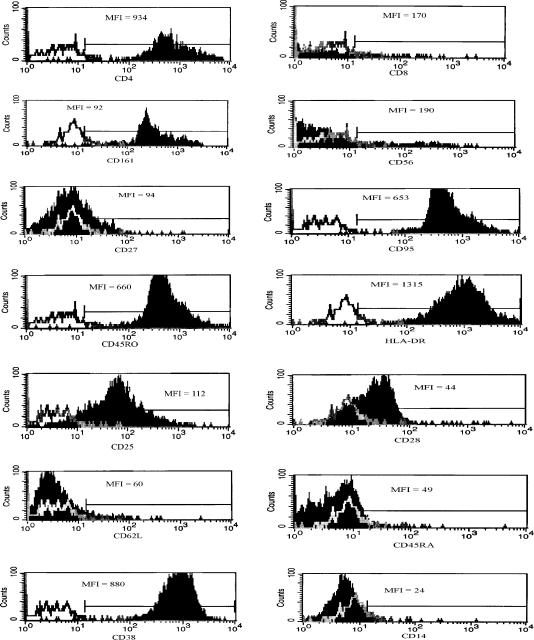
Figure 2.
Expression of cell surface markers on invariant NKT cell clones. (a) A representative example of phenotypic cell surface marker expression on clone CA31 is shown. Vα24+ Vβ11+ T cells, determined by gating on these cells, were also stained for a number of functional (CD4, CD8, CD161, CD56, CD27, CD95, CD25, CD28, CD38, CD14) and activation (CD45RA, CD45RO, HLA-DR, CD38, CD62L) markers. White histogram represents isotype-matched control and dark histogram represents the phenotypic marker of interest. Mean fluorescence intensity (MFI) for each marker is shown within each figure. Results are representative of the three clones.

