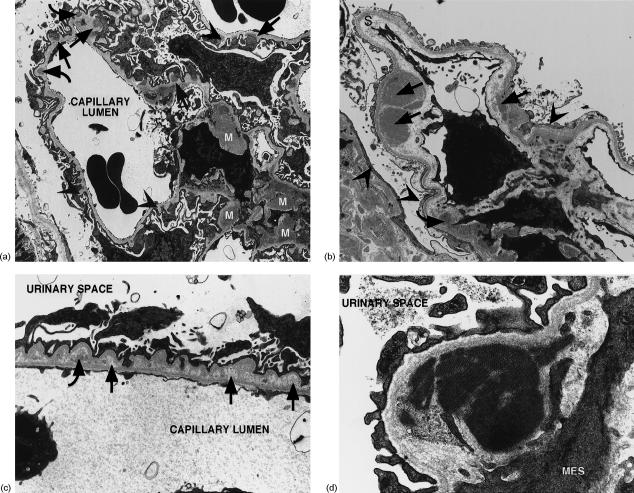
Figure 2.
Ultrastructural changes in renal tissue of BCG-treated NOD mice at 250 days. (a) Electron micrograph of a glomerulus showing a mixed membranous/mesangial pattern of dense deposits. Subepithelial (straight arrows), intramembranous (curved arrows) and mesangial (M) deposits are present, along with GBM spikes (arrowheads). Mag: 2800×. (b) Electron micrograph of a glomerulus showing subendothelial (straight arrows) and mesangial (curved arrows) dense deposits. There is expansion of the subendothelial space or lamina rara interna (S) and effacement of foot processes, particularly over a collapsed segment (arrowheads). Mag: 5400×. (c) Electron micrograph of a segment of GBM showing intramembranous lucent deposits (straight arrows) and partially resorbed dense deposits exhibiting a lucent halo (curved arrows). Foot processes show effacement and podocytes forming microvilli. Mag: 5550×. (d) Electron micrograph of an organized, or crystalline, mesangial dense deposit. MES: mesangial cell. Mag: 20 500×.

