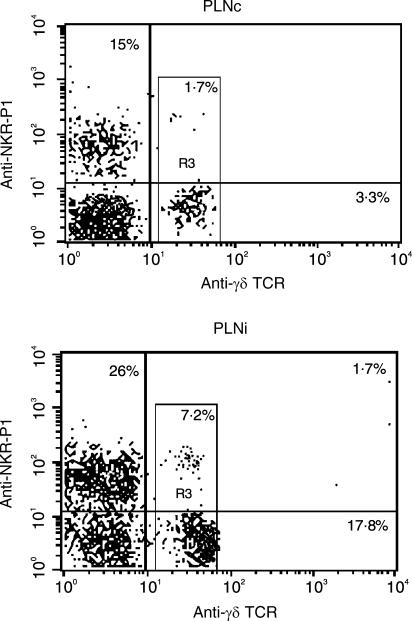
Figure 1.
Co-expression of NKR-P1 (vertical line) with γδ T-cell receptor (TCR) (horizontal line) on preparations of contralateral popliteal lymph nodes (PLNc) and draining PLN (PLNi) from rats 2 days postinfection. Cells were prepared from freshly isolated PLN, stained with monoclonal antibodies (mAbs) and analysed as described in the Materials and methods. Numbers in quadrants of the dot-plots represent the percentage of lymphocytes. Numbers within R3 area correspond to the percentage of double-staining NKR-P1+ γδ TCR+ cells among γδ T cells (R3). Results are typical of six replicate experiments.

