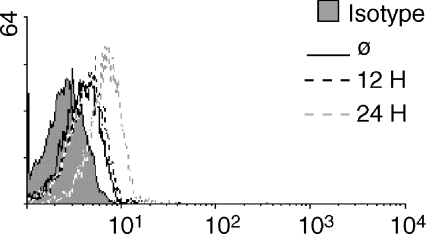
Figure 2.
Stimulation through the TCR increases surface expression of ICAM-1. Resting T cells were left nonstimulated (solid black line) or stimulated with anti-CD3 for 12 (dashed black line) and 24 hr (dashed grey line) and analysed for ICAM-1 surface expression by flow cytometry. The isotype control is indicated by the filled grey histogram. Representative of three experiments.

