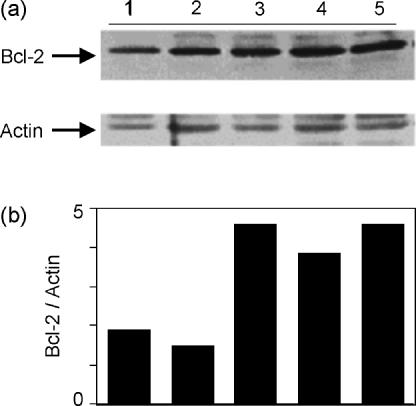
Figure 5.
Costimulation through ICAM-1 increases Bcl-2 protein levels compared to stimulation through the TCR alone. (a) T cells were left non-stimulated (lane 1), stimulated with anti-CD3 alone (lane 2), anti-CD3 + anti-ICAM-1 (lane 3), anti-CD3 + anti-LFA-1 (lane 4), or anti-CD3 + anti-CD28 (lane 5) for 5 days. Protein levels of Bcl-2 were determined by Western blotting. (b) Densitometric ratio of Bcl-2/actin on the same blot. Representative of four experiments.

