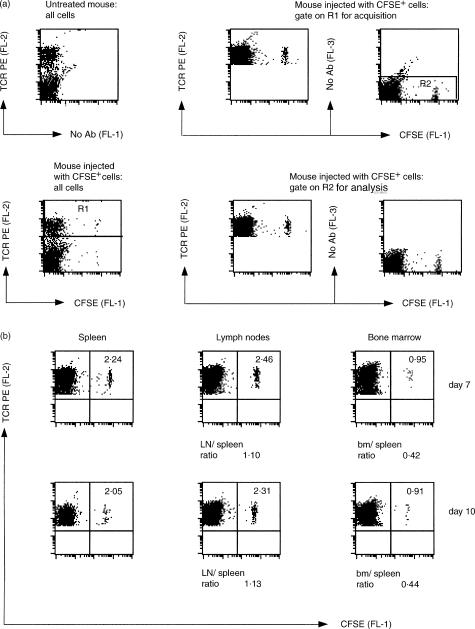
Figure 2.
Flow cytometric analysis of spleen, lymph node (LN) and bone marrow (bm) cells from B6 mice 7–10 days after adoptive transfer of CFSE-labelled syngeneic cells. Spleen and lymph node cells were purified from B6 mice, labelled with CFSE and injected intraperitoneally into age-and sex-matched B6 mice (25 million cells per recipient mouse). Spleen, lymph node and bone marrow cells were then purified from recipient mice, stained with anti-TCRβ PE mAb and analysed by flow cytometry. (a) The panels show the gates used for cell acquisition and analysis by flow cytometry in one typical experiment, 7 days after adoptive transfer. The two left panels show the results obtained with all spleen cells from one untreated mouse (top) and one adoptively transferred mouse (bottom). To focus the experiment on T cells, gating was set to TCR+ cells for acquisition, corresponding to the cells in the R1 region indicated in the bottom left panel. The upper middle and right panels show the results obtained with spleen cells from one adoptively transferred mouse, after gating on R1 for acquisition. To exclude from our analysis highly auto-fluorescent cells, we restricted our analysis to FL-3-negative cells, corresponding to the cells in the R2 region in the upper right panel. The bottom middle and right panels show the data acquired in the R1 region and then gated on R2 for analysis. R1 and R2 gates were always used for spleen, lymph node and bone marrow cell acquisition and analysis. (b) The panels represent the results obtained with spleen, lymph node and bone marrow cells from two representative mice, one analysed 7 days and the other 10 days after adoptive transfer, as indicated. The numbers in the upper right quadrant are the percentages of TCR+ CFSE+ cells within the total TCR+ cells. In untreated B6 mice, the percentage of TCR+ CFSE+ cells in the TCR+ subset was around 0·01. The ratio between the percentages of lymph node and spleen CFSE+ T cells and that between the percentages of bone marrow and spleen CFSE+ T cells are indicated below the panels.

