Figure 4.
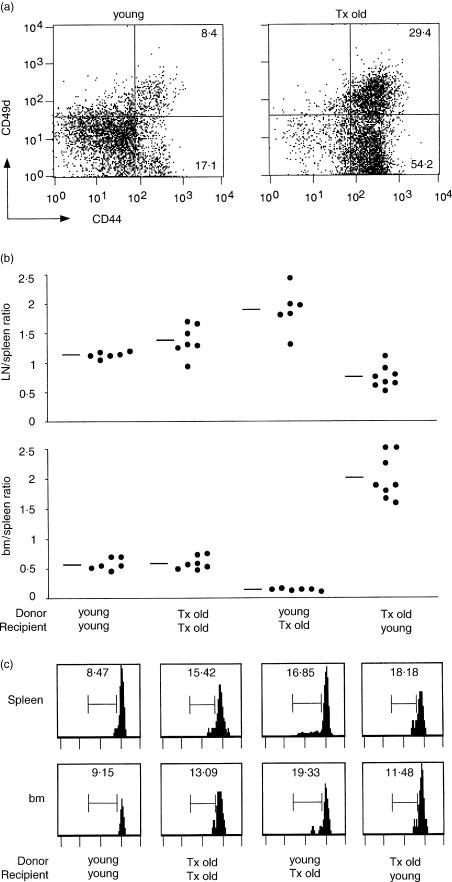
Adoptive transfer experiments with normal young and thymectomized old B6 mice. Enriched populations of CD44−/low and CD44high T cells were obtained by purifying spleen and lymph node cells from, respectively, normal young (2-month-old) and thymectomized old (1-year-old, thymectomized at 1 month) B6 mice. Cells were labelled with CFSE and injected intraperitoneally into either normal young or thymectomized old B6 mice (numbers of cells per recipient mouse: 25–33 million cells from normal young donors; 43–57 million cells from thymectomized old donors; different numbers of total cells from the two type of donors were injected per recipient mouse to compensate for the lower percentages of T cells found in the periphery of thymectomized old compared to young mice, see also in the text). (a) The two panels represent the phenotype of donor T cells from either young or thymectomized old B6 mice (tx = thymectomized). (b) After 7–10 days from adoptive transfer, spleen, lymph node and bone marrow cells were purified from recipient mice and analysed as in Fig. 2. The ratio between the percentages of lymph node and spleen CFSE+ T cells and that between the percentages of bone marrow and spleen CFSE+ T cells of individual mice are represented, as well as the average value of each group (summary of four experiments). Statistical analysis was performed using Students' t-test and differences were considered significant when P ≤ 0·001 (***), P ≤ 0·01 (**) and P ≤ 0·05 (*). Two series of data were considered at a time: first versus second group (*LN/spleen); first versus third group (**LN/spleen; ***bm/spleen); first versus forth group (***LN/spleen; *** bm/spleen); second versus third group (* LN/spleen; *** bm/spleen); second versus forth group (***LN/spleen; ***bm/spleen). (c) The panels represent the FL1 histograms of donor CFSE+ TCR+ cells from spleen and bone marrow of a representative mouse for each group. The scale on the x-axis is logarithmic, in arbitrary units. The numbers represent the percentage of cells in the marked region. Similar percentages were obtained when analysis was performed on lymph node cells.

