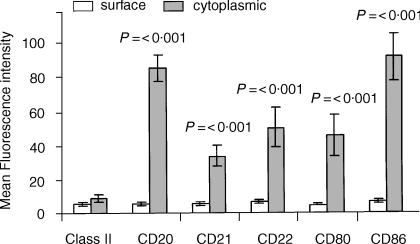
Figure 3.
Comparison of surface versus cytoplasmic staining for CD antigens following fixation and permeabilization of neutrophils: normal donors. Surface and cytoplasmic CD antigens within peripheral blood neutrophils (R3), measured in parallel using the whole blood obtained from 20 normal donors, were compared. Results derived from histogram analysis are expressed as the mean fluorescence intensity (MFI) with vertical bars indicating the mean ± SEM for each CD antigen tested. MFI results, indicating cytoplasmic staining, which were significantly higher than cell surface values are indicated by a P-value (Mann–Whitney test). All values were calculated in relation to non-specific background staining using an appropriate fluorochrome-conjugated, isotype-matched mouse immunoglobulin (Dako). The mean background value for mouse IgG (±SEM) for 20 normal donors was 5 ± 2 for normal cells and 6 ± 2 for permeabilized cells.

