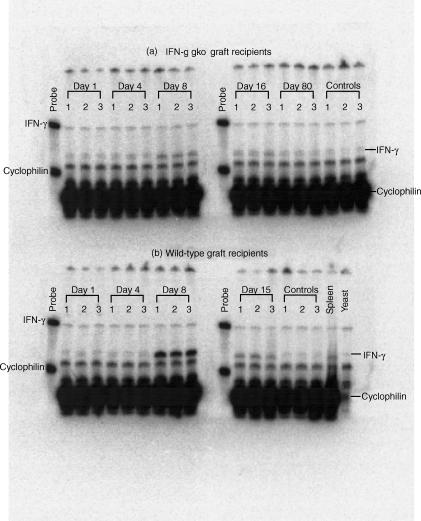
Figure 5.
Phosphorimage showing results from an RNase protection assay used to determine the level of IFN-γ mRNA in intestinal tissue from recipients IFN-γ gko grafts (a) and recipients of wild-type grafts (b). Tissue was collected from three mice at each time-point. Mice were killed on days 1, 4, 8 and 15 post-induction in both recipient groups, and on day 80 post-induction in recipients of IFN-γ gko grafts. Control intestinal tissue was harvested from six B6D2F1-hybrid mice that did not receive grafts. Spleen tissue and yeast were run as positive controls. Bands were quantified with image quant software using the local average background correction.

