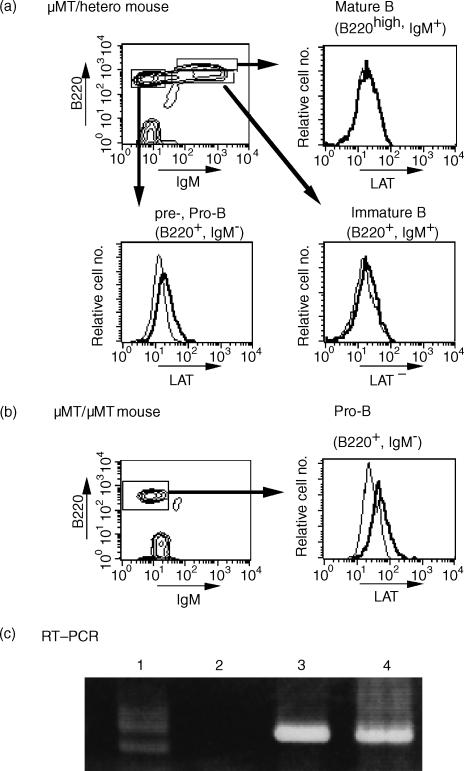
Figure 2.
LAT protein expression in bone marrow cells. Bone marrow cells from µMT/+ mouse (a) or µMT/µMT mouse (b) were labelled with a fluorescein isothiocyanate (FITC)-conjugated goat anti-mouse immunoglobulin M (IgM) antibody and a Cy-Chrome-conjugated rat anti-mouse CD45/B220. Cells were fixed with phosphate-buffered saline (PBS) containing 1% paraformaldehyde, permeabilized with saponin, labelled with anti-LAT antibody and analysed by flow cytometry. Background staining with normal rabbit immunoglobulin G (IgG) is shown for comparison (thin lines in the histogram). Results are representative of three different experiments. Reverse transcription–polymerase chain reaction (RT–PCR) was performed on total RNA prepared from the indicated cells (c). Lane 1, whole bone marrow cells; lane 2, B220+ IgM+ cells; lane 3, B220+ IgM– cells; lane 4, EL4 (T cell). The results were confirmed by another, separate, experiment.

