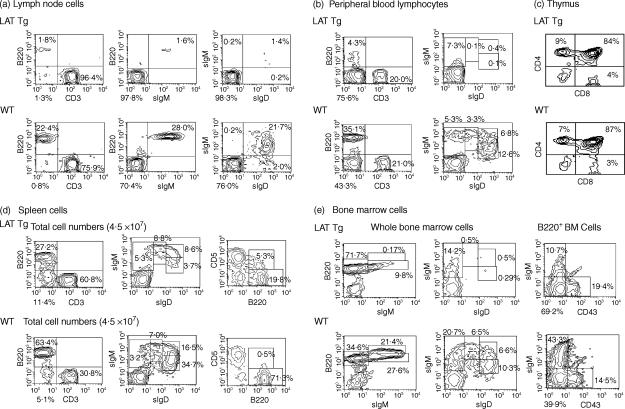
Figure 5.
Flow cytometric analysis of B and T cells in primary and secondary lymphoid tissues from LAT transgenic (Tg) and wild-type (WT) mice. Total cells isolated from lymph node (a), peripheral blood (b), thymus (c), spleen (d) and bone marrow (e), from 8–12-week-old WT and LAT Tg mice, were stained simultaneously with the indicated antibodies and analysed by flow cytometry. The number in each quadrant is indicated as a percentage of the total cells plotted. Results are representative of three different experiments. sIgD, surface IgD, sIgM; surface IgM.

