Figure 2.
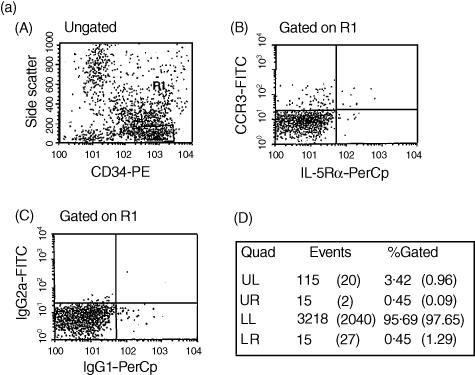
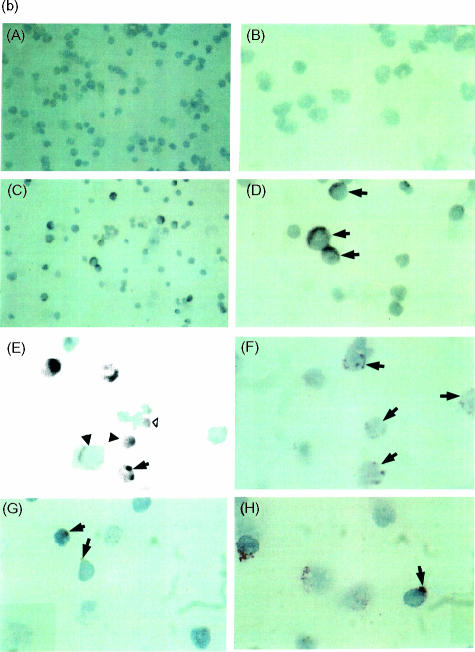
(a) Detection of CC chemokine receptor 3 (CCR3) and interleukin-5 receptor alpha-subunit (IL-5Rα) co-expression on CD34+ cells by flow cytometry. An enriched population of CD34+ cells (purity >85%) from bone marrow non-adherent mononuclear cells (NAMNC) was collected by a magnetic cell separation technique. Cells were stained with CD34–phycoerythrin (PE), anti-CCR3–fluorescein isothiocyanate (FITC) and anti-IL-5Rα–peridinin chlorophyll protein (PerCp). (A) CD34-positive staining events were gated (gate R1); (B) cells within R1 were assessed for co-expression of both CCR3 and IL-5Rα; (C) a 99·9% confidence limit was set for this rare cell type (>0·1% staining with isotype-control antibodies); (D) region statistics show that of the total number of CD34+ cells counted, 3·42% were CD34+ CCR3+, 0·45% were CD34+ IL-5Rα+ and 0·45% were CD34+ CCR3+ IL-5Rα+ (isotype-control values are expressed in parenthesis). The proportion of CD34+ CCR3+ IL-5Rα+ cells represented 11% of the CD34+ CCR3+ cells and 50% of the CD34+ IL-5Rα+ cells in this sample. (b) Co-localization of mRNA for CCR3 to CD34+ cells using sequential immunocytochemistry (ICC) and in situ hybridization (ISH) on cytospins of bone marrow-derived CD34+ cells from an atopic asthmatic subject. (A)–(D) Staining with Dig-labelled CCR3 sense (A, B) and antisense (C, D) riboprobes, at low (magnification × 400; a and c) and high (magnification × 1000; b and d) power. Some of the CCR3 mRNA+ cells (dark blue) are indicated (→). (E) A combination of ICC and ISH in eosinophils (positive control cells) was performed. Single EG2+ stained red is indicated (▵) and single ISH+ (CCR3 mRNA) are dark blue (▴). Double positive cells are dark red (→). (F) Cytospins of purified bone marrow CD34+ cell ICC showing CD34+ cells (→). (G) Single ISH of CCR3 mRNA+ cells (→). (H) Double ICC/ISH of CD34+/CCR3+ cells (→).


