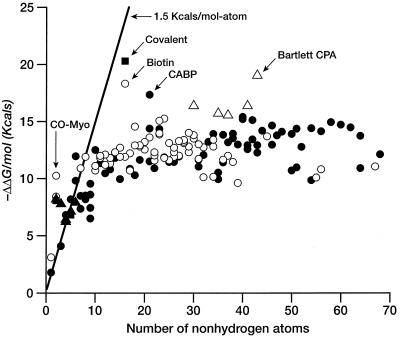
Figure 1.
Free energy of binding (in kcal/mol) for ligands and enzyme inhibitors plotted as a function of the number of nonhydrogen atoms in the ligand. See Table 1. A line with slope of 1.5 kcal/mol and an intercept of 0 is included as a visual aid to analysis. ▵, Metal ions or metalloenzymes; ▴, small anions; ○, natural ligands; ●, enzyme inhibitors.

