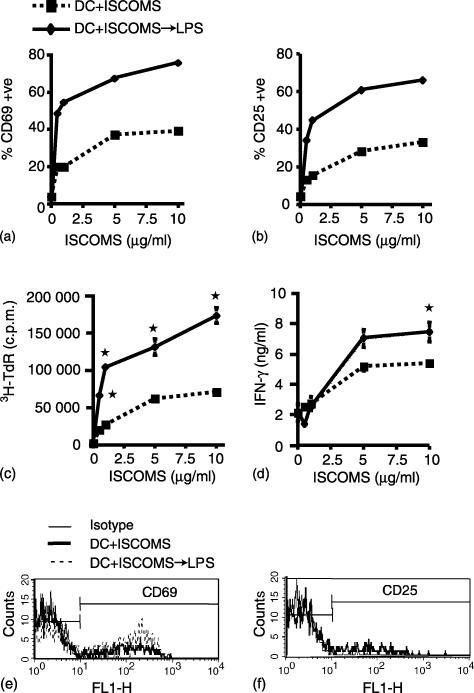
Figure 6.
Antigen dose-dependent activation of antigen specific CD4+ T cells by ISCOM-associated antigen presented by DC. BM DC were pulsed with 0–10 µg/ml OVA ISCOMs for 2 hr or with OVA ISCOMs followed by stimulation with LPS for 24 hr, washed and cultured with DO11.10 lymphocytes for 72 hr. (a and b) Expression of CD69 and CD25 on CD4+ KJ1.26+ T cells, assessed by flow cytometry after 24 hr in culture. (c) 3H-TdR incorporation and (d) IFN-γ production were assessed after 72 and 48 hr in culture, respectively. (e and f) FACS plots showing CD69 and CD25 expression on CD4+KJ1·26+ T cells 24 hr after culture with DC pulsed with 0·5 µg/ml OVA ISCOMs. The results shown are mean ± 1 SD from triplicate cultures. (*P < 0·01 versus responses with equivalent concentration of OVA ISCOMs in the absence of LPS).

