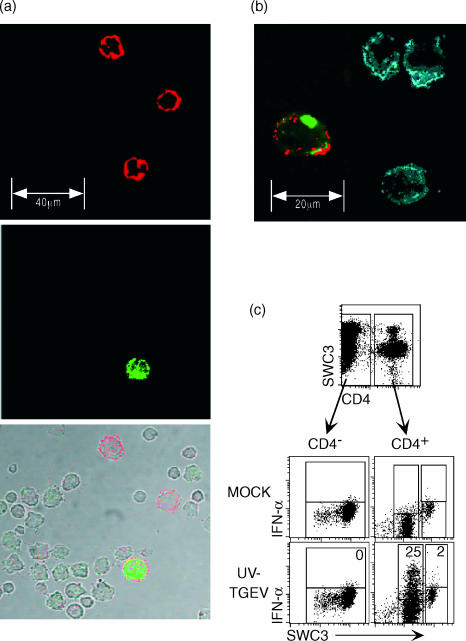
Figure 5.
Identification of NIPC. SWC3+ sorted PBMC were stimulated with mock or UV-inactivated TGEV and cultured for 6 hr. NIPC were identified using triple immunofluorescence analysis of SWC3/CD4/IFN-α expression. After cell surface labelling, the cells were fixed and permeabilized to detect intracellular cytokine. (a) Confocal laser scanning microscopy: CD4 (upper plot, red), IFN-α (middle plot, green) and Nomarski/CD4/IFN overlay (bottom plot). (b) SWC3/CD4/IFN-α expression a different selection with higher magnification. (c) Triple immunofluorescence of SWC3/CD4/IFN-α expression analysed by FCM: Using electronic gates CD4+ and CD4− fractions were defined (upper plot). The intracellular SWC3/IFN-α staining of these fractions after MOCK (middle plots) and UV-TGEV-stimulation (lower plots) is shown. The numbers shown in the latter plots represent the percentage of IFN-α positive cells relative to the SWC3+ CD4−, SWC3low CD4+ and the SWC3high CD4+ subsets as defined by electronic gates. A representative experiment out of five is shown.

