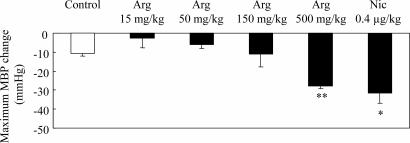
Fig. 2.
Responses of MBP during l-arginine infusion at four different doses of 15, 50, 150, and 500 mg/kg, and nicardipine infusion at 0.4 μg/kg. Each column and vertical bar shows the mean ± SEM. ∗, P < 0.05; ∗∗, P < 0.01; significantly different vs. control value determined by factorial analysis of variance followed by Dunnet's test for mean values comparison.

