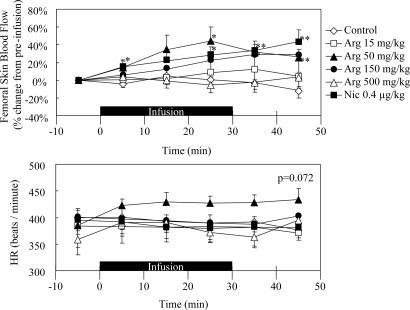
Fig. 3.
Time course changes of femoral skin blood flow by using laser Doppler flow method and heart rate (HR) during l-arginine [Arg 15 (15 mg/kg l-arginine for 30 min), Arg 50 (50 mg/kg l-arginine for 30 min), Arg 150 (150 mg/kg l-arginine for 30 min), Arg 500 (500 mg/kg l-arginine for 30 min)] and nicardipine (Nic; 0.4 μg/kg nicardipine for 30 min) i.v. infusion. (Upper) Each point represents the percent change in MBF from preinfusion at 10-min intervals. (Lower) The individual values of mean heart rate at 10-min intervals are shown. Solid underbars represent sample infusion time. Data are illustrated as means ± SEM. ∗, P < 0.05; ∗∗, P < 0.01; significantly different vs. control value determined by factorial analysis of variance followed by Dunnet's test for mean values comparison.

