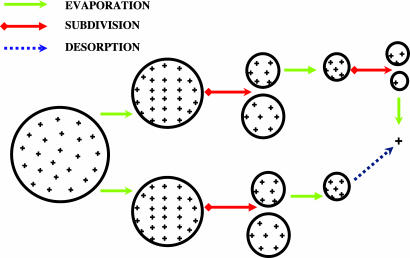
Fig. 1.
A schematic representation of the possible pathways for ion formation from a charged liquid droplet. The upper and the lower parts of the diagram illustrate the ion formation mechanisms depicted in the CRM of Dole et al. (2, 3) and the IEM of Iribarne and Thomson (4), respectively. + represents a desolvated solute ion. The major difference between these two models is that the final ion in the latter model is produced by desorption, whereas the ion in the former model is produced by evaporation of solvent comprising the droplet.

