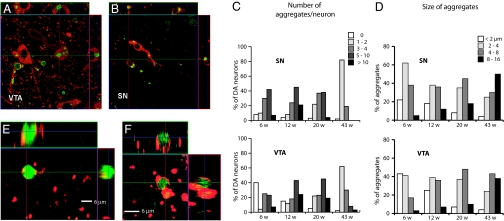
Fig. 4.
Analysis of intracellular inclusions. (A and B) Confocal microscopy images of immunoreactive inclusions (green) in TH immunoreactive DA neurons (red) of VTA and SN. (C) Quantification of number of aggregates per DA neuron in SN and VTA of MitoPark mice at different ages. (D) Size of aggregates in DA neurons in SN and VTA of MitoPark mice at different ages. (E and F) High magnification confocal images of aggregates after double immunofluorescence labeling to detect inclusions (green) and mitochondria (red).

