Figure 3.
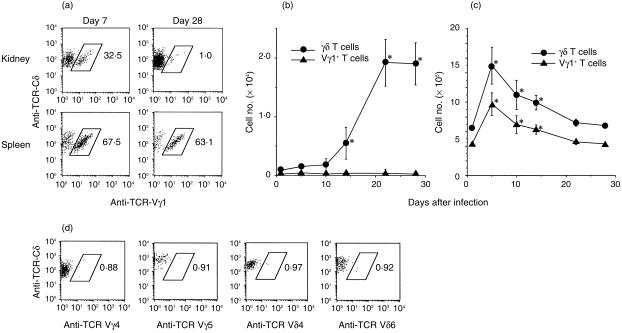
Kinetics of TCR γδ T cells and Vγ1+ T cells in the kidneys and spleens of mice with persistently infected kidneys after intrarenal inoculation with L. monocytogenes. (a) Profiles of TCR Vγ1-positive cells from right kidneys and spleens were analysed by gating on both CD3-and TCR-Cδ-positive cells. The numbers of γδ T cells and Vγ1+ cells per kidney (b) and spleen (c) were further calculated based on the number of lymphcytes harvested per mouse and the percentage of γδ T cells or Vγ1+ T cells. Closed circles and triangles represent the data of γδ T cells and Vγ1+ T cells, respectively. *P < 0·05 compared to the data on day 0. (d) Profiles of TCR Vγ4-, Vγ5-, Vδ4- and Vδ6-positive T cells in γδ T cells from the right kidneys on day 28. The data shown are representative of individual analyses of 14 mice.

