Figure 4.
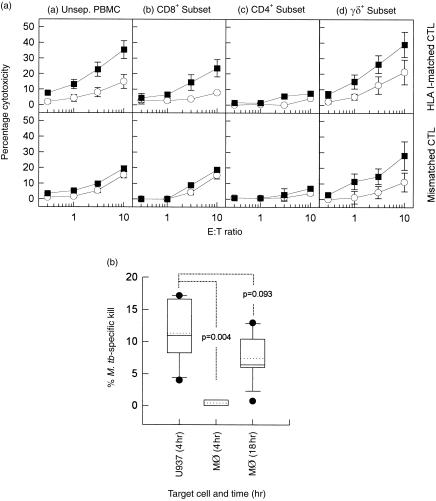
(A) Characterization of cytolytic T-cell subsets generating mycobacterial-specific cytolysis against U937 target cells. Mycobacterium tuberculosis-primed human leucocyte antigen (HLA)-B51-matched cytotoxic T lymphocytes (CTL) (RG and BR; top panel) and the HLA-mismatched CTL (MF and WM; bottom panel) populations were either (a) not separated, or fractionated into (b) CD8+ (c) CD4+ or (d) γδ+ T-cell subsets, and assessed for their respective cytolytic abilities against U937 target cells. U937 target cells were either infected with M. tuberculosis (5 colony-forming units [CFU]/cell) (▪) or pulsed with an irrelevant antigen, streptokinase-streptodornase (SK-SD) (○). Each data point represents the mean percentage cytolysis (± SEM) of at least three independent experiments. (B) Comparison of CD8+ CTL cytolytic activity generated by HLA-B51-matched donors (n = 2; RG and BR) against U937 versus macrophage (Mφ) targets. Mycobacterial-specific cytolysis was calculated according to the following equation: Cytotoxicity was measured after 4 hr for U937 targets, and after 4 and 18 hr for Mφ targets (as indicated). Each box-and-whisker plot shows the distribution, median (solid line), mean (dotted line), 10th and 90th percentile of six independent experiments. M.tb, Mycobacterium tuberculosis.

