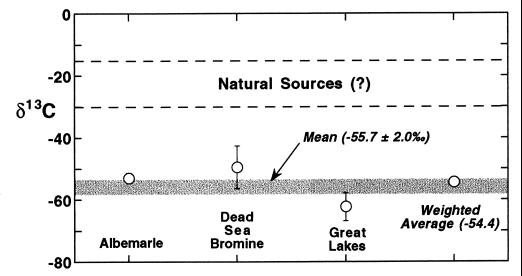
Figure 1.
Mean measured δ13C values for industrial CH3Br from the major manufacturers and comparison with the expected range of natural sources. The error bars shown are SDs, based on multiple samples from each manufacturer. The horizontal shaded line represents the mean for all tanks, without weighting by manufacturer. The weighted average (Table 2) accounts for the percentage of total production from each manufacturer.

