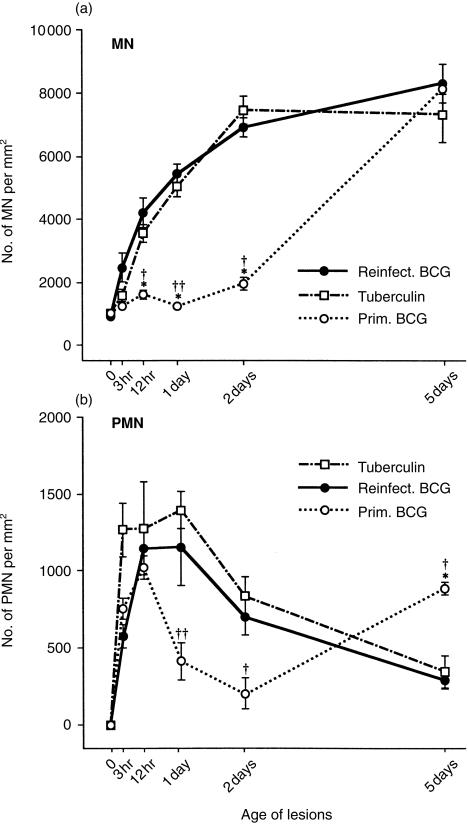
Figure 3.
Number of MN (a) and PMN (b) per mm2 of tissue section at various times in reinfection BCG lesions, in tuberculin reactions, and in primary BCG lesions. The reinfection BCG lesions and tuberculin reactions show no differences in the density of either cell type, but the primary lesions contain fewer MN per mm2 than the others at 12 hr and at 1 and 2 days. The total number of MN and PMN in each type of lesion can be estimated by combining the data depicted here with that depicted in Figure 1 (see Discussion). Each point represents the mean of four lesions with its standard error: for reinfection BCG lesions versus primary BCG lesions: *P < 0·05; and for tuberculin reactions versus primary BCG lesions: †P < 0·05 and ††P < 0·01.

