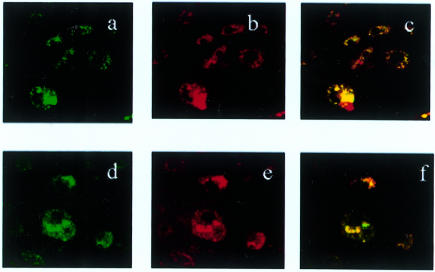
Figure 5.
The intracellular distribution of CpG ODN in BMMΦ. SRA−/− (a, b, c) and BALB/c BMMΦ (d, e, f) were simultaneously incubated with 10 µg/ml of BODIPY-labelled CpG ODN and Texas red labelled dextran at 37° for 30 min. The distribution of CpG ODN (green) and dextran (red) was assessed by laser scanning confocal microscopy after incubation. Photographs (c and f) show the colocalization of CpG ODN and dextran (yellow) in the cells. Magnification, ×630.

