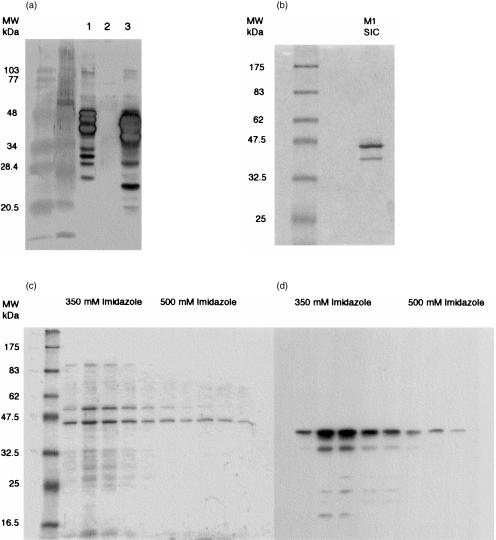
Figure 2.
Western blot analysis of recombinant and native SIC(a) Western blot showing reactivity of rabbit polyclonal antibody to native SIC and recombinant SIC: (1) rSIC; (2) E. coli protein extract negative control; (3) concentrated M1 culture supernatant. Lower MW bands are presumed to represent breakdown products of SIC and rSIC. (b) Coomassie stained 10% SDS–PAGE gel of purified native SIC. The lower band is a breakdown product of SIC. N-terminal sequencing of this band showed that 33 amino acids had been lost from the native protein. (c) Coomassie stained 10% SDS–PAGE gel of rSIC-containing column fractions, and (d) autoradiograph of a Western blot from an identical SDS–PAGE gel demonstrating that rSIC eluted mainly at 350 mm imidazole. rSIC was detected using HRP-conjugated monoclonal anti-V5 epitope and chemiluminescence. Non-reactive bands in panel (c) are residual E. coli proteins.

