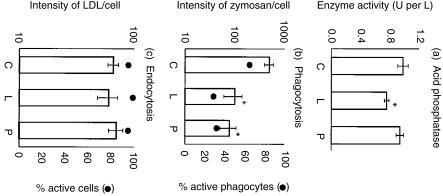
Figure 2.
Functional differentiation of LPS- and PMA-treated monocytes. (a) The activity of tartrate-resistant acid phosphatase in differentiating monocytes: untreated control (C), and LPS-treated (L) or PMA-treated (P). Samples (1 ml) from adherent cell cultures were assayed for the secreted enzyme after 3 days of culturing, in which the medium was replaced 24 hr before testing. The data shown are minus the values for culture medium alone, and are expressed as means ± SEM from triplicate experiments. (b) The capacity of differentiating monocytes to phagocytose BODIPY fluorescein-Zymosan (50 particles/cell, 30 min/37°) following LPS or PMA treatment of the monocytes for 72 hr. The values for fluorescence intensity of the phagocytosed zymosan are expressed as means ± SEM from triplicate experiments (y1-axis; histograms); the values for the actual percentage of cells phagocytosing shows means only, the SEM being < 5% (y2-axis; •). (c) Endocytic activity of differentiating monocytes treated with either LPS or PMA for 72 hr was measured by the uptake of 20 µg/ml BODIPY-fluorescein LDL complex for 30 min/37°. The data and values (y1-axis; histograms) for fluorescence intensity of the LDL complex are expressed as in (b) above, and the percentage of cells that incorporated the LDL shows means only, the SEM being < 5% (y2-axis; •). Statistical analyses were performed using the Student's t-test; * indicates P < 0·05 for treatment vs. control.

