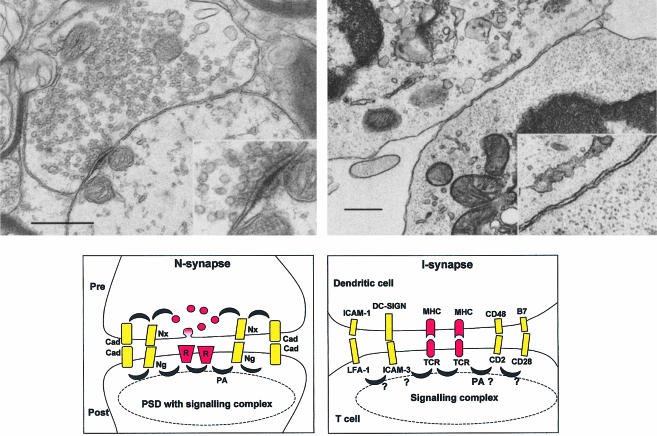
Figure 1.
Comparison between N- and I-synapses. Top: electron micrographs of glycinergic synapse (left, courtesy of Dr A. Triller) and of a T–DC synapse (right, courtesy of Dr G. Raposo). Scale: 0·5 µm (0·25 µm for the insets). The inset of the N-synapse highlights the presence of a PSD. Bottom: schematic summary of molecules involved at the N- and I-synapses (left and right). R, neurotransmitter receptor; Nx, neurexin; Ng, neuroligin; Cad, cadherin; PA, first row adaptors; PSD, postsynaptic density; TCR, T-cell receptor; MHC, major histocompatibility complex.

