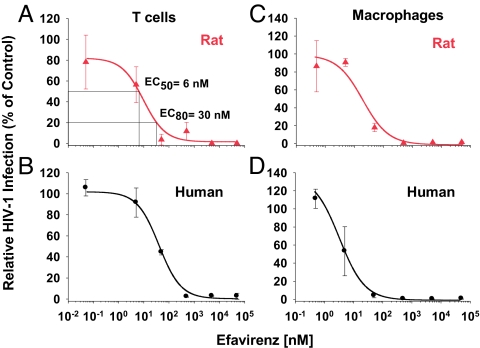
Fig. 1.
Dose–response curves for the antiviral potency of the NNRTI efavirenz in ex vivo cultures of primary T cells and macrophages from hCD4/hCCR5-transgenic rats and humans. (A and B) Activated T cells from double-transgenic rats and human donors were pretreated with efavirenz for 1 h and subsequently challenged with VSV-G HIV-1NL4–3 EGFP viruses. (C and D) Macrophages from double-transgenic rats and human monocyte-derived macrophages were pretreated with efavirenz overnight and then challenged with VSV-G HIV-1NL4–3 EGFP viruses. On day 3 postinfection, the percentage of EGFP-positive cells was scored by flow cytometry. The percentage of infected cells in untreated controls was set at 100%, and relative levels of HIV-1 infection are shown. Each experiment was performed in triplicate, and one to four experiments were conducted. Given are arithmetic means ± SD of one experiment. EC50 and EC80 values were determined by using Prism software (GraphPad, San Diego, CA) and are shown in A and in Table 1.

