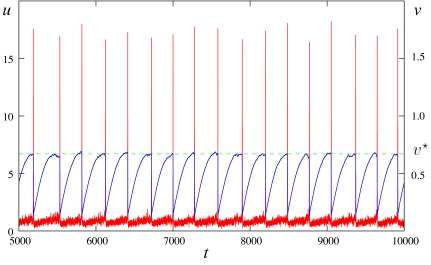
Fig. 4.
The time series of u(x0, y0, t) (red line) and v(x0, y0, t) (blue line) in Fig. 1 is shown, where (x0, y0) is the point at the center of the computational domain. Observed is a localized version of self-induced stochastic resonance. The dashed green line shows the average jump-off value of v = v*.

