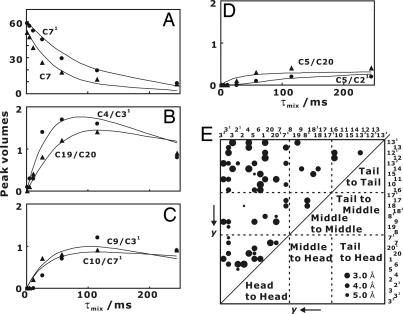
Fig. 3.
Build-up curves for 13C 13C spin diffusion. Experimental (symbols) and simulated (lines) cross-peak intensities are presented. (A) Intensities of diagonal peaks for C71 (●) and C7 (▴). (B) Cross-peaks C4/C31 (●) and C19/C20 (▴). (C) Cross-peaks C9/C31 (●) and C10/C71 (▴). (D) Cross-peaks C5/C21 (●) and C5/C20 (▴). (E) Experimental 13C
 13C distance map for rj,keff calculated from the polarization-transfer matrix on the BChl c assembly. Carbons are arranged in the order of the y coordinate defined in Fig. 1A. The diameters of circles are inversely proportional to the distances as shown by examples.

