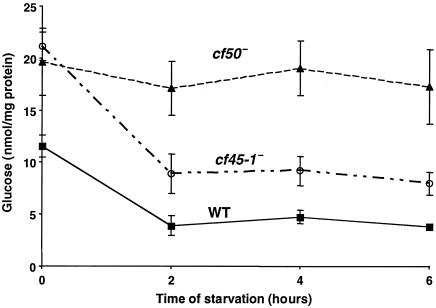
FIG. 10.
Both cf45-1− and cf50− cells have high levels of glucose. Cells were grown to 1 × 10⁶ cells/ml in shaking culture in HL5, washed in PBM buffer, and starved in shaking culture for the indicated times. Cells were then collected by centrifugation, and the amount of glucose in the lysed cells was measured. WT indicates parental Ax2 cells. Values are means ± standard errors of the means from four independent experiments.

