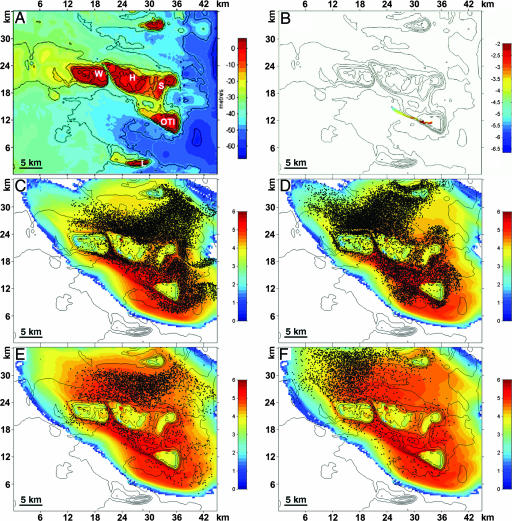
Fig. 1.
Bathymetric map and hydrodynamic modeling of the study area. (A) Bathymetric map including OTI, S, H, Wistari (W), and L reefs. F reef is located to the southeast of L just outside the map area of this model; Wistari is not included among our study reefs. Color scale: water depth in meters. (B) Snapshot of particle positions at 6 h, the initial flood tide carrying particles away from OTI; color is log concentration, with red highest. Particles were released at a frequency of 250 particles per model time step (=50 s) for 1.4 h, giving a total of 25,200 particles. (C–F) Particle concentration (log10) averaged over 8 and 20-day periods (ebb and flood, respectively) shows strong connectivity between reefs and high concentrations near the reef of origin (OTI); superimposed on these color images are snapshots of particle positions at ebb and flood times. Heron Island is located exactly on the Tropic of Capricorn, at 151° 55′ longitude.

