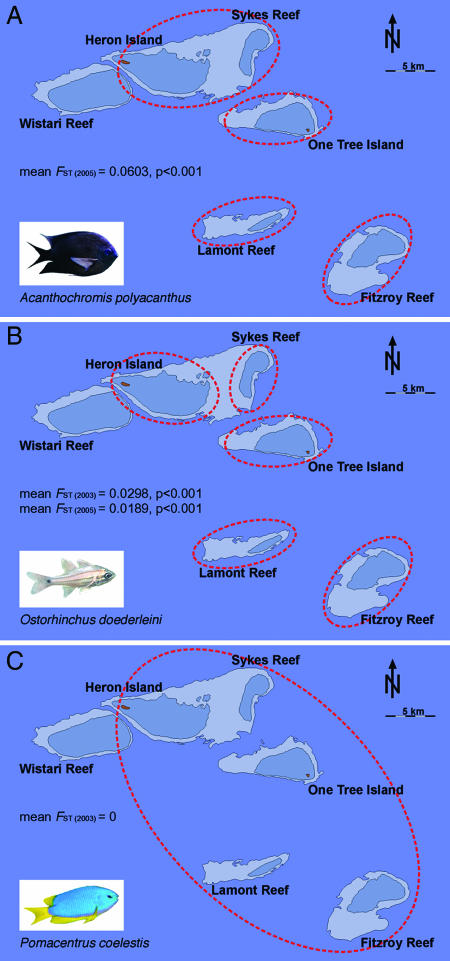
Fig. 2.
Genetic substructure of three fish populations across five test reefs. (A) A. polyacanthus without pelagic larval dispersal stage. (B) O. doederleini with 3-week larval dispersal. (C) P. coelestis with 3-week larval dispersal. Red dotted circles enclose genetically different populations. Mean FST values among reefs are provided on the graph.

