Fig. 2.
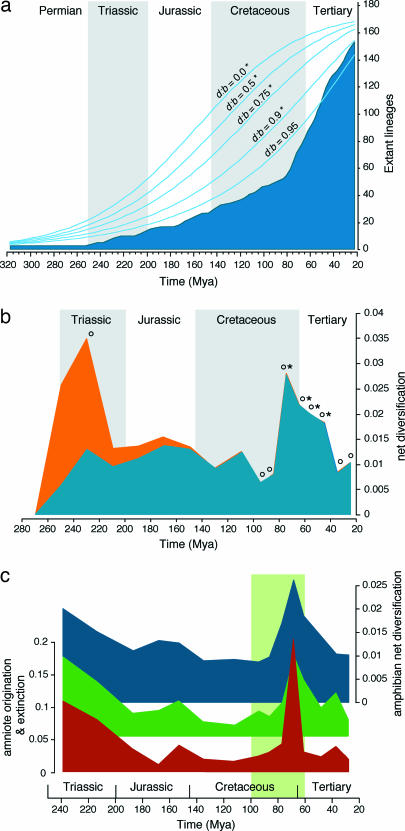
Global patterns of amphibian net diversification. (a) LTT plot derived from the timetree, compared with constant-diversification models with relative extinction rates (b:d) ranging from 0 to 0.95. Asterisks indicate rejection of the null model by a goodness-of-fit test and a Markov-chain constant-rate test (Bonferroni-corrected α = 0.01). (b) RTT plot showing net diversification rates estimated under d:b = 0 (red) and d:b = 0.95 (blue) for successive 20-Myr intervals (280–100 Mya) and 10-Myr intervals (100–20 Mya). Rate estimates that significantly differ from those expected under constant diversification along the entire plot (P < 0.05) are indicated by a circle (d:b = 0) or an asterisk (d:b = 0.95). (c) Comparison of amphibian net diversification rates (blue, back) with amniote family origination and extinction rates documented by the fossil record (green, middle and red, front, respectively) (4). Note that amphibian and amniote rates are represented at different scales. The green rectangle represents the time window in which angiosperms underwent their major radiation (47).

