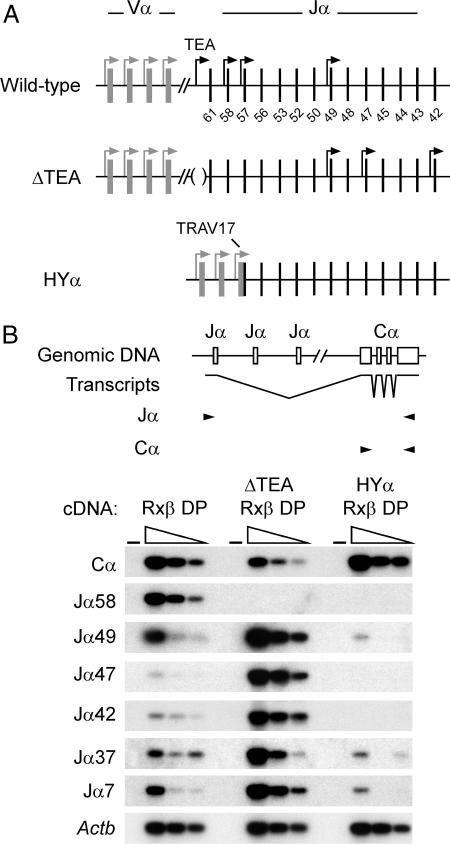
Fig. 1.
Tcra allele structure and germ-line transcription. (A) Schematic maps of the wild-type, ΔTEA, and HYα Tcra alleles are shown. The gray rectangles identify Vα segments, and black vertical lines represent Jα segments (numbered). Bent arrows identify the locations of active promoters. The diagram depicts changes in promoter activity on the ΔTEA and HYα alleles. (B) RT-PCR analysis of Tcra transcripts. The structure of spliced Jα transcripts and the PCR strategies used to detect individual Jα transcripts and total Cα-containing transcripts are presented. PCR primers are indicated by arrowheads. Serial 3-fold dilutions of cDNA prepared from R×β, ΔTEA R×β, and HYα R×β thymocytes were analyzed by RT-PCR to detect Jα transcripts, total Cα-containing transcripts, or β-actin (Actb) transcripts. (−) indicates a control PCR lacking cDNA. PCRs were analyzed by Southern blotting with Cα or Actb probes. Because of variations in PCR efficiency, PCR cycle number, and exposure time, the figure should not be taken to indicate quantitative relationships among the different transcripts; however, for any individual transcript, quantitative comparisons are valid among the different thymus RNA samples.

