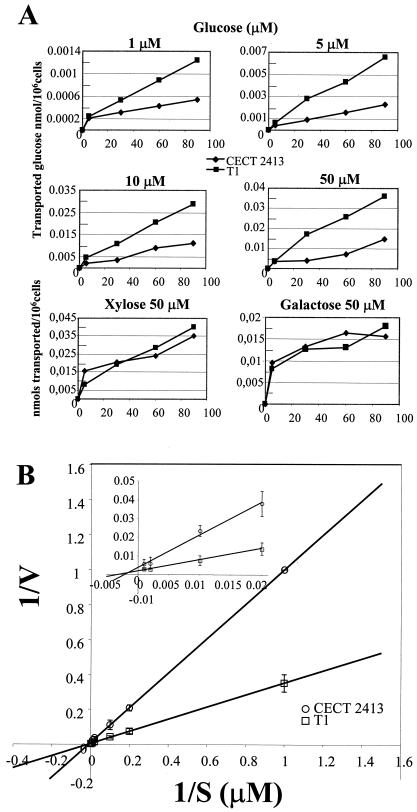
FIG. 6.
Kinetics of uptake of d-glucose. (A) Uptake of d-glucose, d-xylose, and d-galactose (nanomoles of glucose transported per million living cells) for Trichoderma strains CECT 2413 (wild-type strain) and T1 (strain that overexpresses the gtt1 gene). The amount of sugar used in each transport assay is indicated above each graph. (B) Double-reciprocal plots used to obtain the Km and Vmax values for high-affinity d-glucose transport. The inset is an amplification of the 1/S values from 0 to 0.02 μM. V, velocity. Error bars indicate standard deviations.

