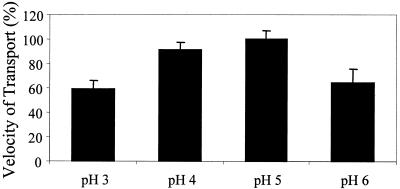
FIG. 7.
Decreased uptake of d-glucose at acidic pH. The uptake of d-glucose was measured by using 10 μM d-glucose and different phosphate buffers at pH 3, 4, 5, or 6. Transport velocity was obtained by using slopes of the linear regression of d-glucose uptake at 0, 5, 30, 60, and 90 s. Error bars indicate standard deviations.

