Figure 1.

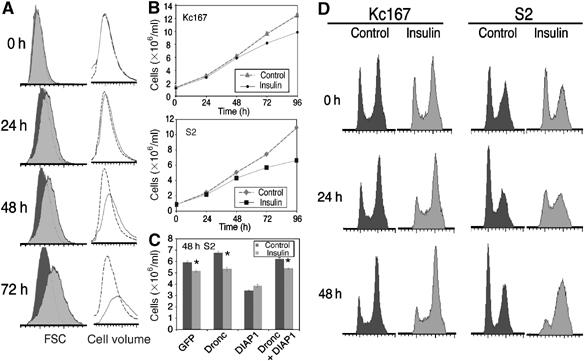
Insulin slows cell proliferation and increases the proportion of cells in S and G2 phases. (A) A 1 μM concentration of insulin increases the size of S2 cells seeded at 1 × 10⁶ cells/ml, as detected by FSC measurements of a defined number of cells (dark grey indicates control population, light grey indicates insulin-treated population) and Coulter counter cell volume measurements of a defined volume of cells (black dotted line indicates control population, grey solid line indicates insulin-treated population). A 15–20% increase in cell volume is consistently observed by 48 h. (B) Insulin at 1 μM slows the rate of increase in cell number of Kc167 and S2 cells measured using a Coulter counter. Data represent mean±s.d. from three replicates, although the s.d.s are too small to be discernable. (C) S2 cells were treated with dsRNAi corresponding to GFP (control), Dronc or DIAP1 for 72 h, then reseeded at 1 × 10⁶ cells/ml with fresh dsRNA and treated with 1 μM insulin for a further 48 h. dsRNAi-mediated depletion of Dronc does not affect the ability of insulin to slow the increase in S2 cell number, but prevents the reduction in cell number induced by dsRNAi-mediated depletion of DIAP1. Coulter counter cell count data represent mean±s.d. from three replicates (*P<0.01). Results shown in (C) are representative of two independent experiments. (D) Flow cytometer cell-cycle profiles of control and 1 μM insulin-treated Kc167 and S2 cells seeded at 1 × 10⁶ cells/ml show that over 48 h, insulin reduces the proportion of cells in G1 and increases the proportion of cells in G2. Results shown in (A), (B) and (D) are from the same experiment and are representative of at least five independent experiments.
