
Figure 5.
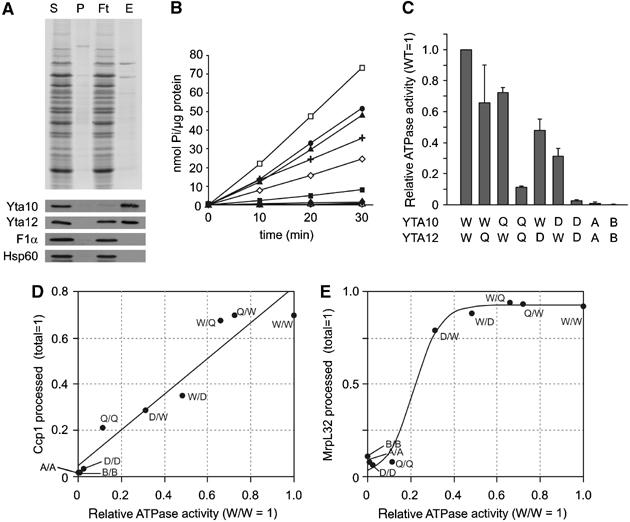
ATPase activities of purified m-AAA protease variants. (A) Purification of m-AAA protease variants by metal chelating chromatography. After expression of Yta10 harbouring a C-terminal histidine tag and Yta12 in Δyta10Δyta12 cells, m-AAA protease complexes were isolated by Ni-NTA chromatography. Upper panel: SDS–PAGE analysis of various fractions followed by Coomassie staining: S, soluble fraction applied to Ni-NTA beads (40 μg); P, insoluble pellet fraction after solubilisation; Ft, flow-through fraction (40 μg); E, eluate fraction (80 ng protein). Bottom panel: Western blot analysis of various fractions using antisera directed against Yta10, Yta12, Hsp60 and the α-subunit of the F1-particle of the F1FO-ATP synthase. (B, C) ATPase activities of m-AAA protease variants in vitro. A kinetic analysis is shown in (B). The ATPase activities of the variants relative to the wild-type m-AAA protease are shown in (C). Standard deviations are indicated (n=3). Open square (W/W), Yta10/Yta12; closed square (Q/Q), Yta10E559Q/Yta12E614Q; closed diamond (D/D), Yta10D634A/Yta12D689A; open circle (A/A), Yta10K334A/Yta12K394A; open triangle (B/B), Yta10E388Q/Yta12E448Q; closed circle (Q/W), Yta10E559Q/Yta12; closed triangle (W/Q), Yta10/Yta12E614Q; open diamond (D/W), Yta10D634A/Yta12; cross (W/D), Yta10/Yta12D689A. (D) Correlation of Ccp1 processing efficiencies in vivo with the in vitro ATPase activity of m-AAA protease variants. Accumulating mature Ccp1 (quantified in Figure 4C) was plotted against relative ATPase activities of m-AAA protease variants. Linear fitting (black line; R=0.962) is shown. (E) Correlation of processing efficiencies of MrpL32 in vivo with the ATPase activity in vitro. Sigmoid fitting is shown (SSE: 0.0181).