Figure 2.
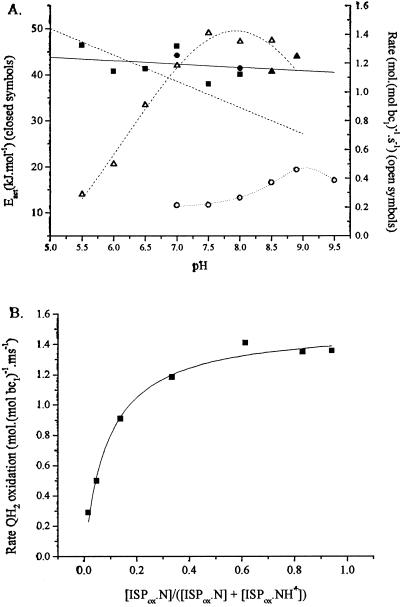
Kinetic parameters for partial reactions. (A) Filled symbols (left-hand axis): Dependence of activation energy on pH for quinol oxidation. Each point represents a separate set of experiments in which the reaction was measured as a function of temperature and the data were analyzed with an Arrhenius plot. Reactions measured: ■, reduction of cyt bH (pH values <8.5), or ▴, reduction of cyt bL (pH values ≥8.5), with quinol pool 30% reduced; ●, slow phase of electrochromic change, with quinol pool 90% reduced. Solid line, linear fit to data; dashed line, slope of −5.7 kJ⋅mol−1. Open symbols (right-hand axis), rate of quinol oxidation: ▵, native bc1 complex (average of two experiments, assayed by cyt bH reduction); ○, mutant Y156W (at 2 × scale, assayed through slow phase of electrochromic change, quinone pool 30% reduced). (B) The dependence of rate of quinol oxidation on concentration of ISPox. Data from A for the pH dependence of cyt bH reduction have been replotted to show the variation of rate with dissociated [ISPox], calculated using a pK of 7.6 on ISPox.

