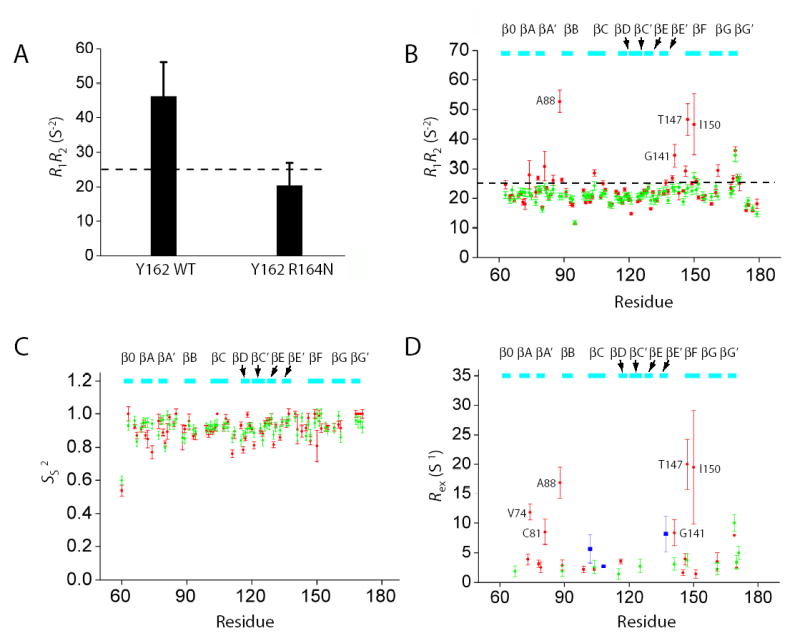
Figure 5. NMR relaxation results for the R164N Runt domain.

(A) 15N R1* R2 values for Y162 in the wild-type Runt domain-DNA and R164N Runt domain-DNA complexes measured in 15N-Tyr specifically labeled samples at 500 MHz. Error bars represent the fitted error for the R1 and R2 measurements propagated to the R1* R2 values. The dashed line indicates the theoretical value of R1*R2 for τc=15 ns, 11 T, and S2=1.0. The difference between the wild-type and R164N Runt domain was significant at P < 0.0001 by Student’s t-test.
(B–D) Relaxation data (15N R1* R2, Ss2, and Rex) for the wild-type and R164N Runt domain (complexed to DNA) measured from [U-2H,15N]-labeled samples at 500 MHz. The dashed line in Panel B indicates the theoretical value of R1*R2 for τc=15 ns, 11 T, and S2=1.0. Data for the wild-type protein are from Yan et al. 37. For Panels B–D, wild-type protein data are in red and R164N data are in green. Data are only shown for residues that could be analyzed in both proteins. Five residues could not be adequately fit using ModelFree and are not shown in panels C and D. Residues showing Rex in the CBFβ-Runt domain-DNA complex are shown in blue in panel D.
