Figure 1.

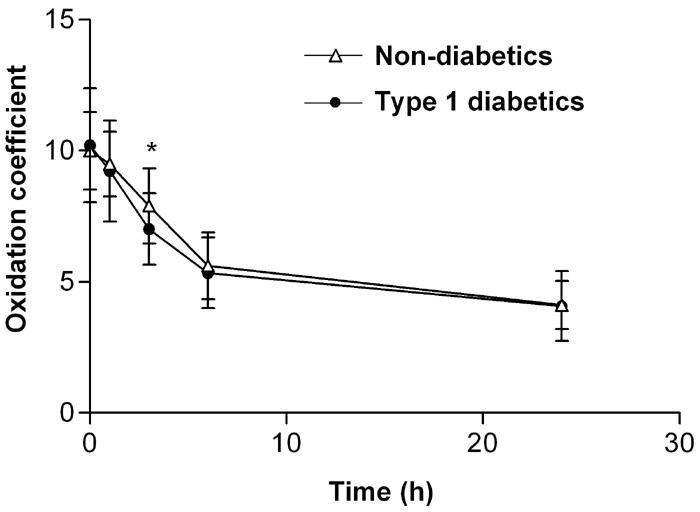
LDL oxidation coefficient (OxC) curve showing a significant difference between patients with type 1 diabe-tes (n = 40) and non-diabetic subjects (n = 33) 3 h after administration of CuSO4. * p = 0.01.

LDL oxidation coefficient (OxC) curve showing a significant difference between patients with type 1 diabe-tes (n = 40) and non-diabetic subjects (n = 33) 3 h after administration of CuSO4. * p = 0.01.