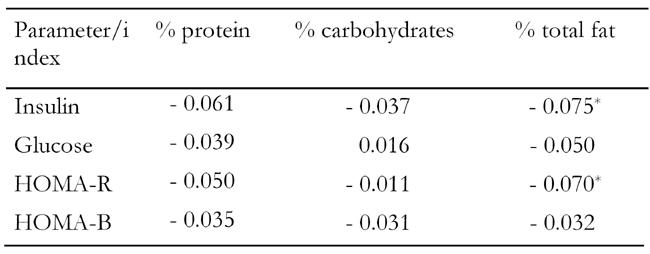
Table 3. Partial correlation coefficients between indices of glycemic control and macronutrient intake.

Correlation coefficients were adjusted for age and sex. HOMA: homeostasis model assessment. HOMA-R: assessment of insulin resis-tance. HOMA-B: assessment of insulin secretory capacity. * p < 0.05.
