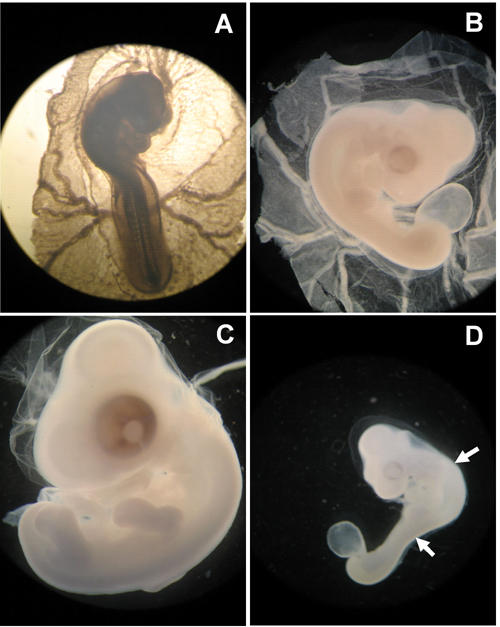
Figure 4. Effects of glucose on chick embryos (HH 18-20).

A: Untreated control embryo. B: Embryo treated with 0.9% saline developed normally. C: Embryo treated with 50 mM glucose showing macrosomia. D: Embryo treated with 100 mM glucose. Abnormal flexion and torsion are prominent.
