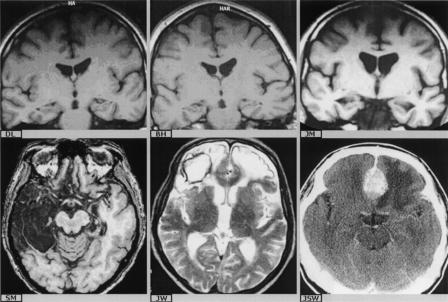
Figure 5.
(Top row) Representative coronal sections showing hippocampal atrophy only (H−) in patients “D.L.” and “B.H.” (cerebal hypoxia), and parahippocampal and hippocampal atrophy (H+) in patient “J.M.” (cerebral hypoxia). (Bottom row) Axial sections showing bilateral medial temporal lobe pathology and extensive right antero-lateral pathogy in patient “S.M.” (herpes encephalitis) and bilateral frontal pathology in patients “J.W.” (contusion and hemorrhage) and “J.S.W.” (meningioma).

